Every day our country suffers from russian attacks. Fires destroy Ukrainian land and pollute the air. In 2022, 3 million hectares of forests in Ukraine were destroyed as a result of russian bombardment (as of November 28, 2022).
Therefore, we saw the need to monitor the fire areas so that everyone could see the current situation and know what kind of air we breathe.
We worked hard on this and finally added visualization of fires and their environmental consequences to our interactive map, and today you will learn how it works!
How do we do it? In simple words:
- We receive and process satellite images. We verify the fire.
- Identify its characteristics (coordinates, temperature, and amount of emissions)
- Model the polluting emission cloud and calculate where it will take the emissions
We told more about how our system works at the Sustainable Solutions 2022 conference (link)
We use satellite images from the Sentinel-2 and Sentinel-3 satellites as a basis. The Copernicus Sentinel-2 mission consists of two polar-orbiting satellites placed in the same sun-synchronous orbit, phased at an angle of 180° to each other. It is aimed at monitoring the variability of the Earth’s surface conditions, its wide coverage (290 km), and long re-visits will support monitoring of changes in the Earth’s surface for some time.
The main objective of the Sentinel-3 mission is to measure sea surface topography, sea and land surface temperature, and ocean and land surface color with high accuracy and reliability to support ocean forecasting, and environmental and climate monitoring systems.
The Sentinel-3 Mission Manual provides a high-level description of the mission objectives, satellite description, and ground segment. It also covers an introduction to the legacy missions, thematic areas and services, orbit and coverage characteristics, instrument payloads, and data products.
The Sentinel-3 mission is co-managed by ESA and EUMETSAT to provide operational ocean and land observation services.
https://dataspace.copernicus.eu/explore-data/data-collections/sentinel-data
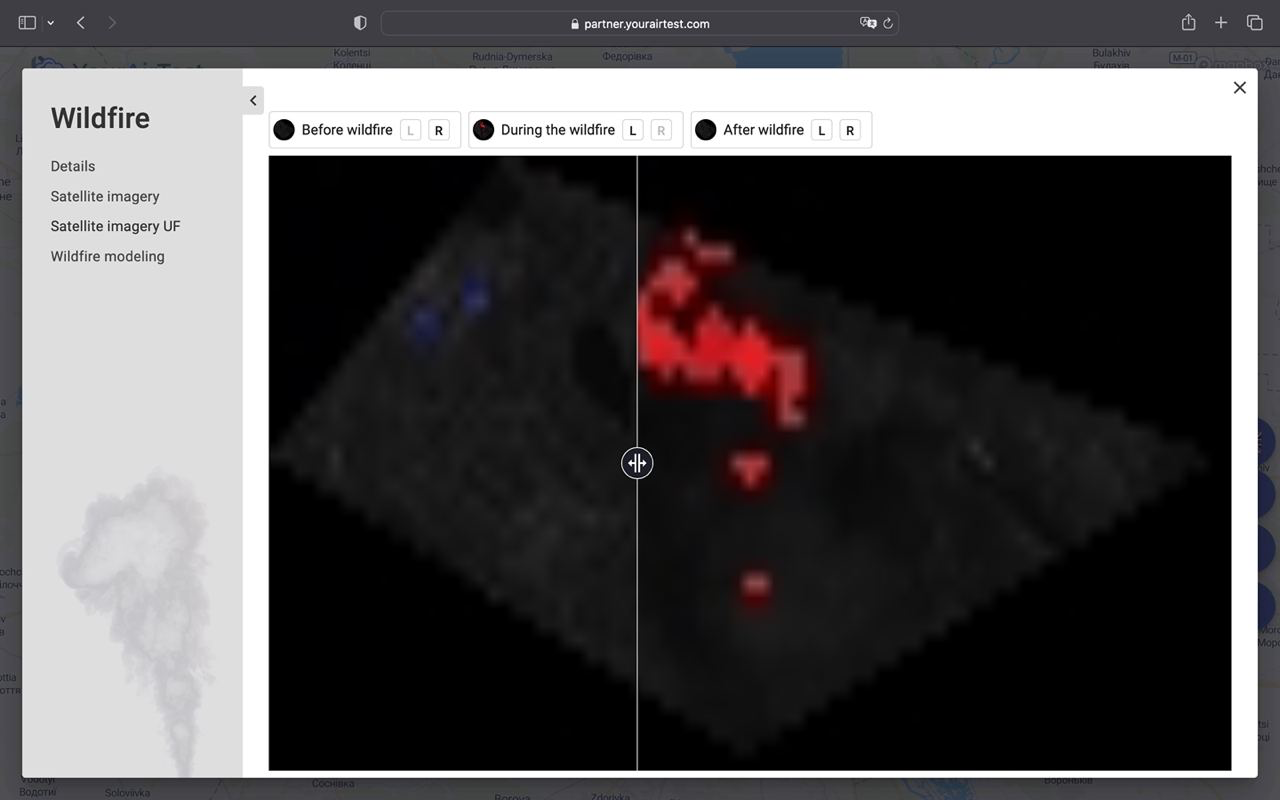
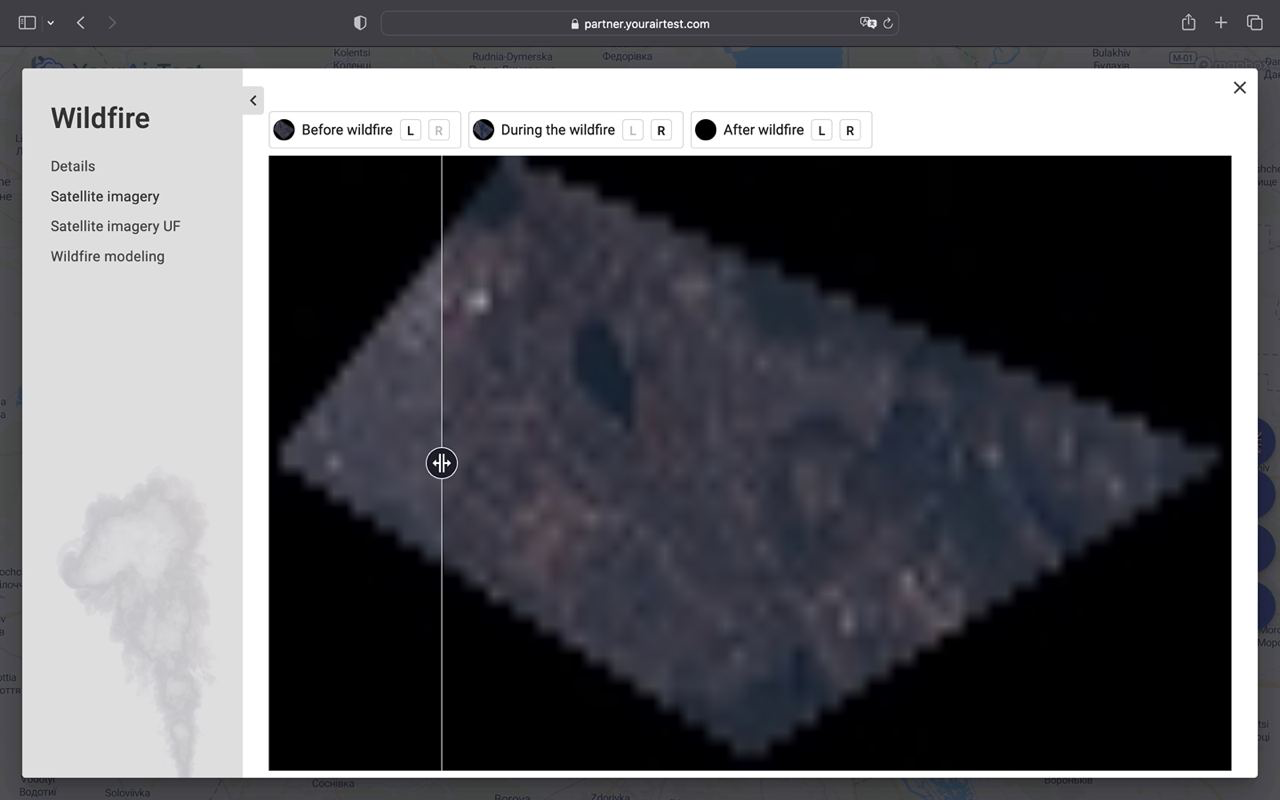
The API first collects data on all images in the area observed in the modeling, and then a query is made using these coordinates, with a built-in script that highlights certain waves of the B channel.
Our script colors the pixels where radiation is observed. A request is also made in parallel for photos without processing, for visual damage assessment. The photos are saved with the geo-coordinates of the site. After that, all the photos are scanned to find the affected pixels. Based on the pixel coordinates, a polygon is created for further CALPUFF calculations. As a result of these queries, a JSON file with vertex coordinates, temperature
Website guide
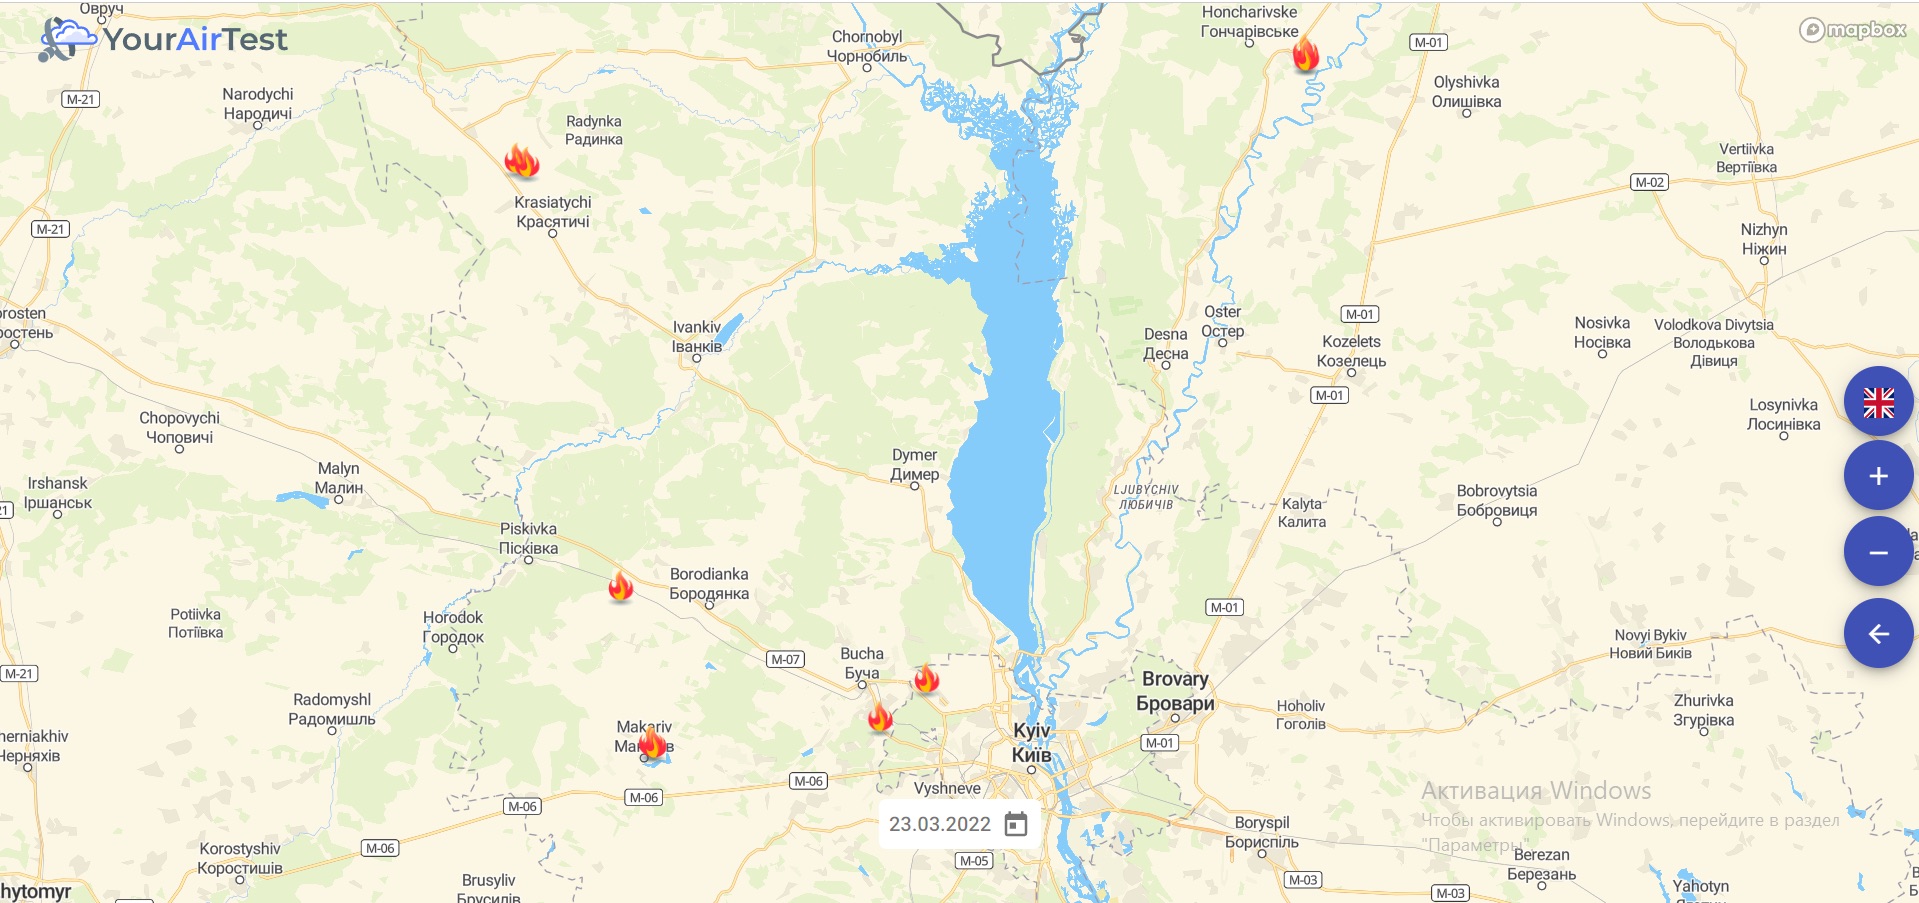
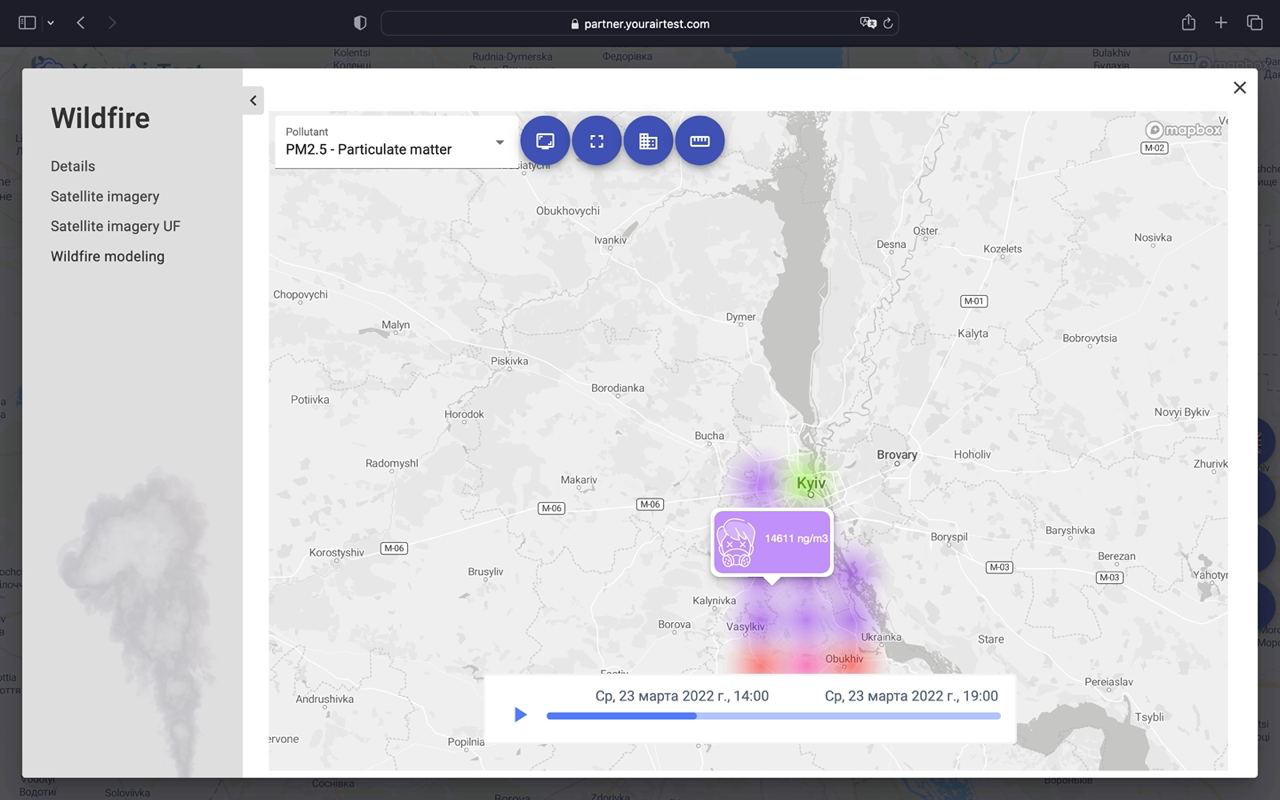
The interactive map has a calendar that stores information about fires since February 24, 2022 (5 months have been processed so far, and we are working hard to add all fires)
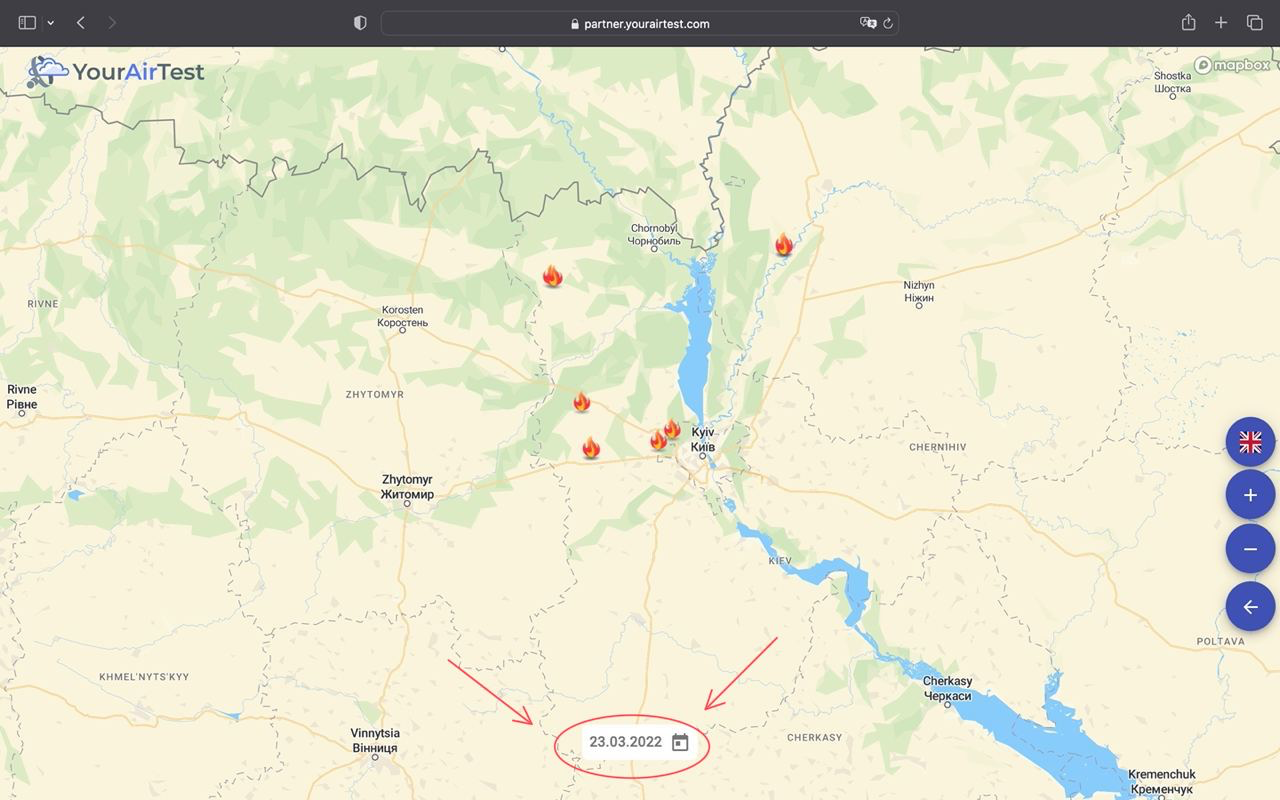 The fire markers indicate where the fire sources were located on that day (they are grouped, so if you zoom in, you will get more information)
Clicking on them opens a menu with details:
- Temperature
- Number of emissions during the observation period
- Coordinates
- Area
3D visualization
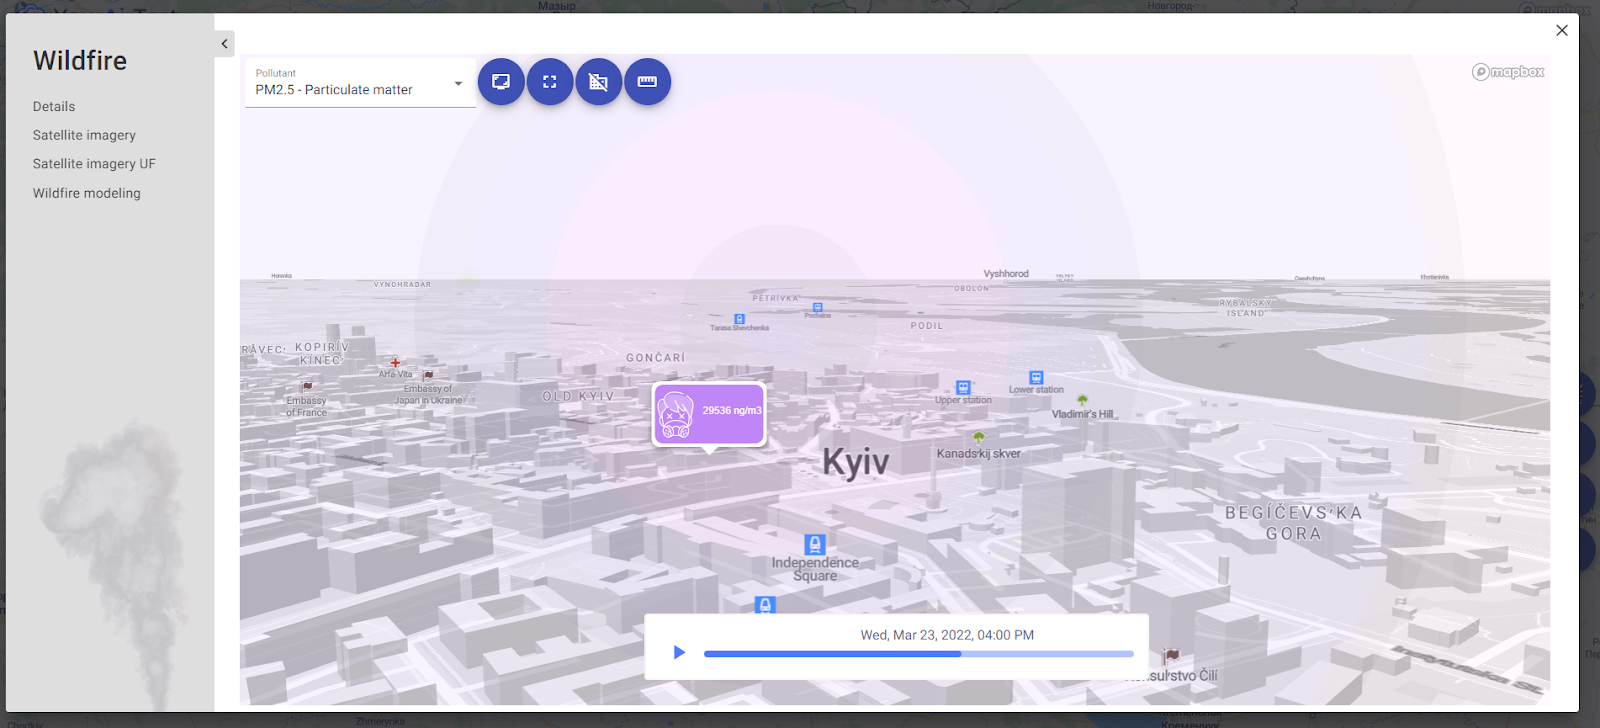
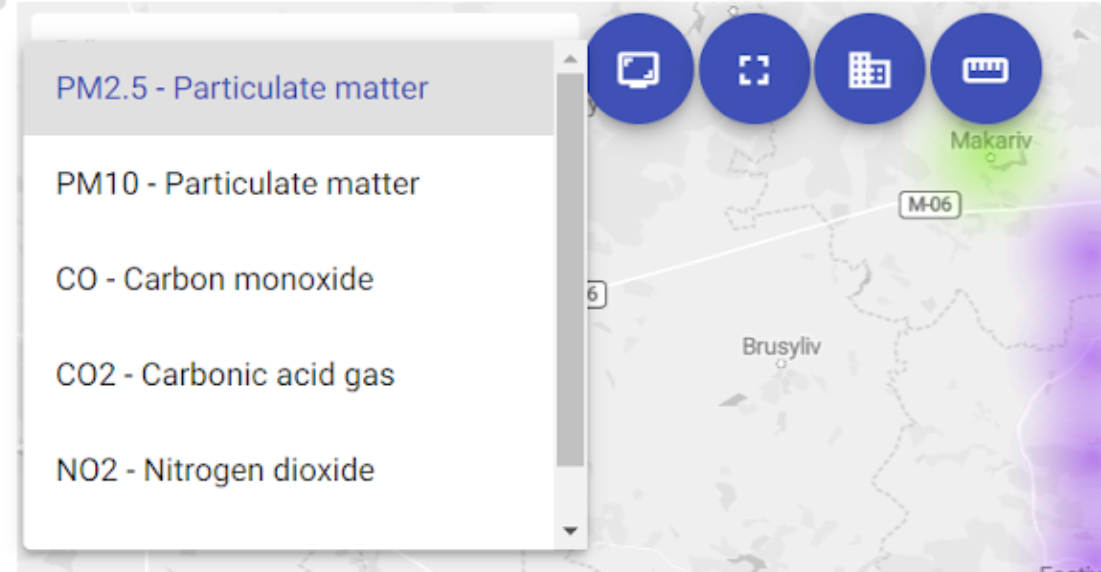
Above is a clickable menu that helps you select the pollutant you need (dust or gas) and displays the concentration of these impurities on the map (colored dots):
- O3 (ozone);
- NO2 (nitrogen dioxide);
- SO₂ (sulfur dioxide);
- CO (carbon monoxide);
- PM2.5 Particulate matter;
- PM10 Particulate matter.
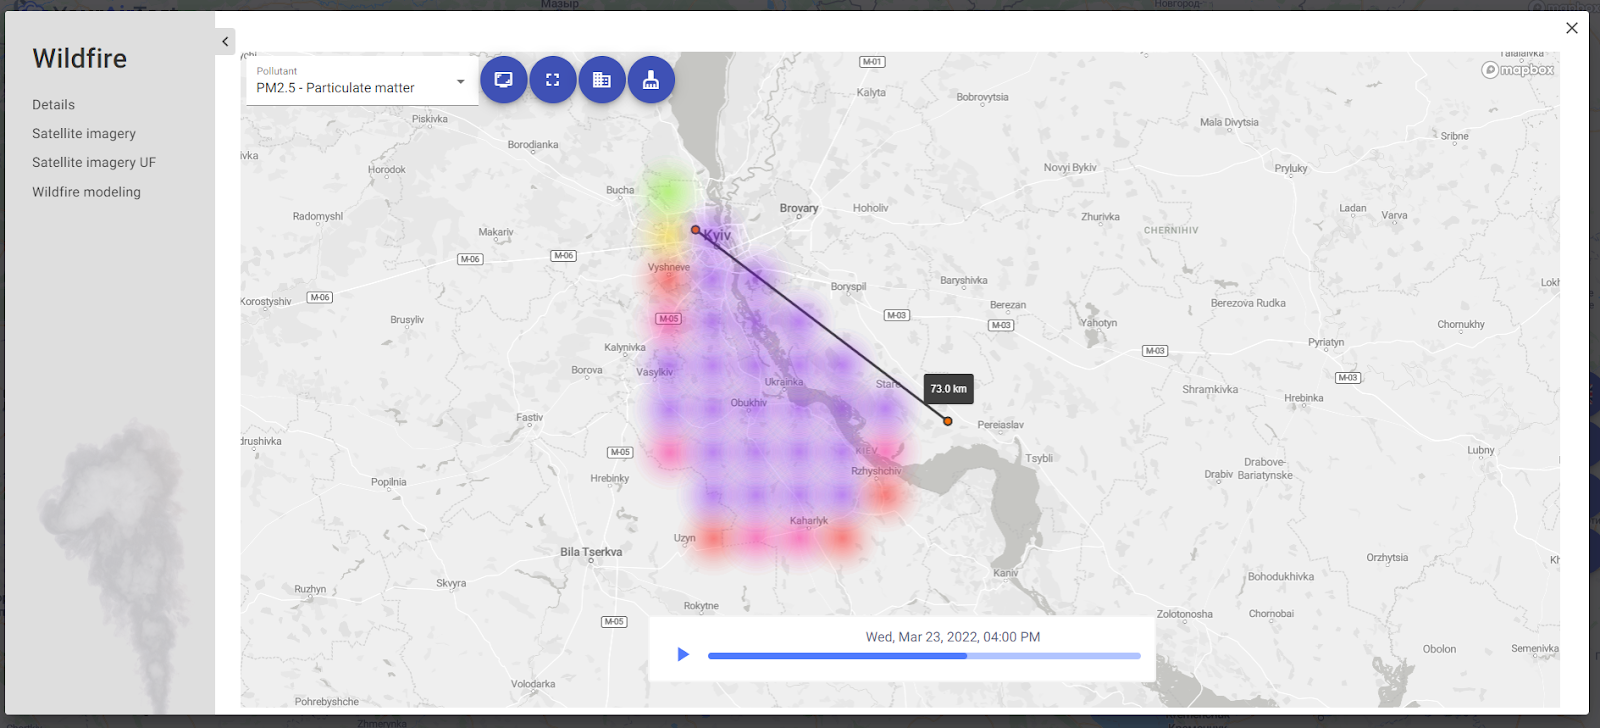
 You can also enable a special ruler in the same menu to help you understand the size of the fire and smoke. This is useful for better calculating the area of air pollution.
 The site is available in two languages (Ukrainian and English) so that our foreign colleagues can contribute to the development and make it easy for everyone to use!
Follow the link and try it!
Ukrainian startup ecosystem: follow TechUkraine and AIN.ua — the two leading outlets covering Ukrainian deep tech, climate tech, and environmental startups.
Follow Ukrainian media: Ekonomichna Pravda, Mind.ua, and Hromadske regularly cover the environmental consequences of war, air pollution, and infrastructure risk in Ukraine.
What to do today
- Check the YourAirTest air map for your city.
- If this resonated — share the article.
- Subscribe to our articles on air quality in Ukraine.