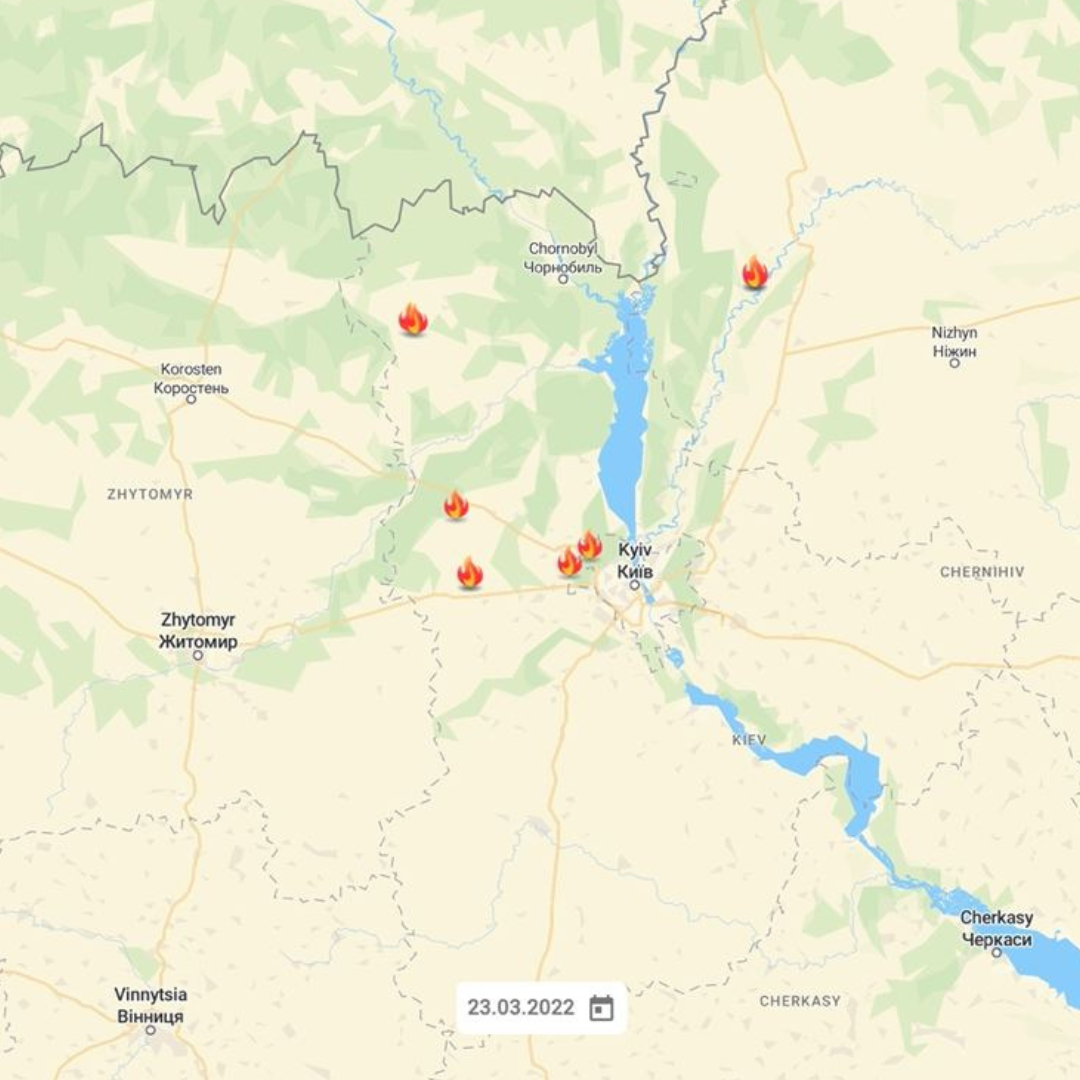
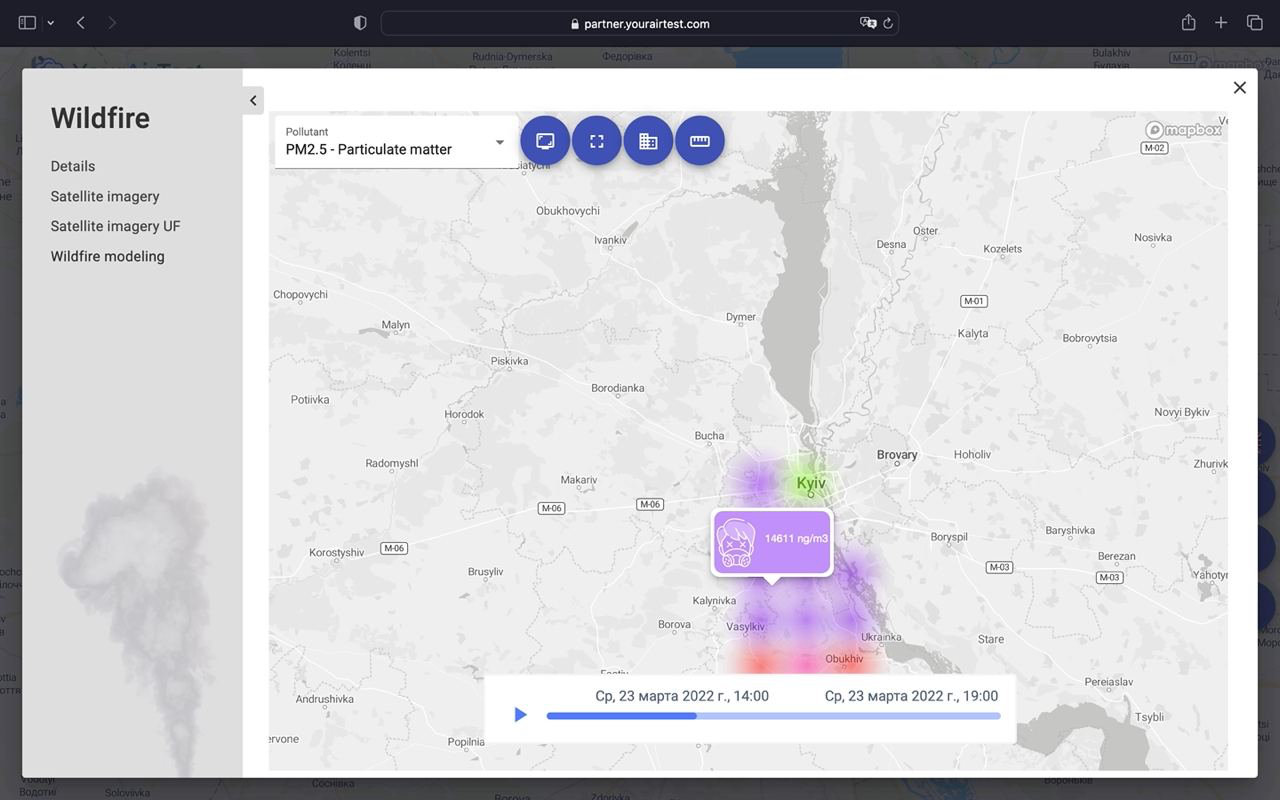
The interactive map has a calendar that stores information about fires since February 24, 2022 (5 months have been processed so far, and we are working hard to add all fires)
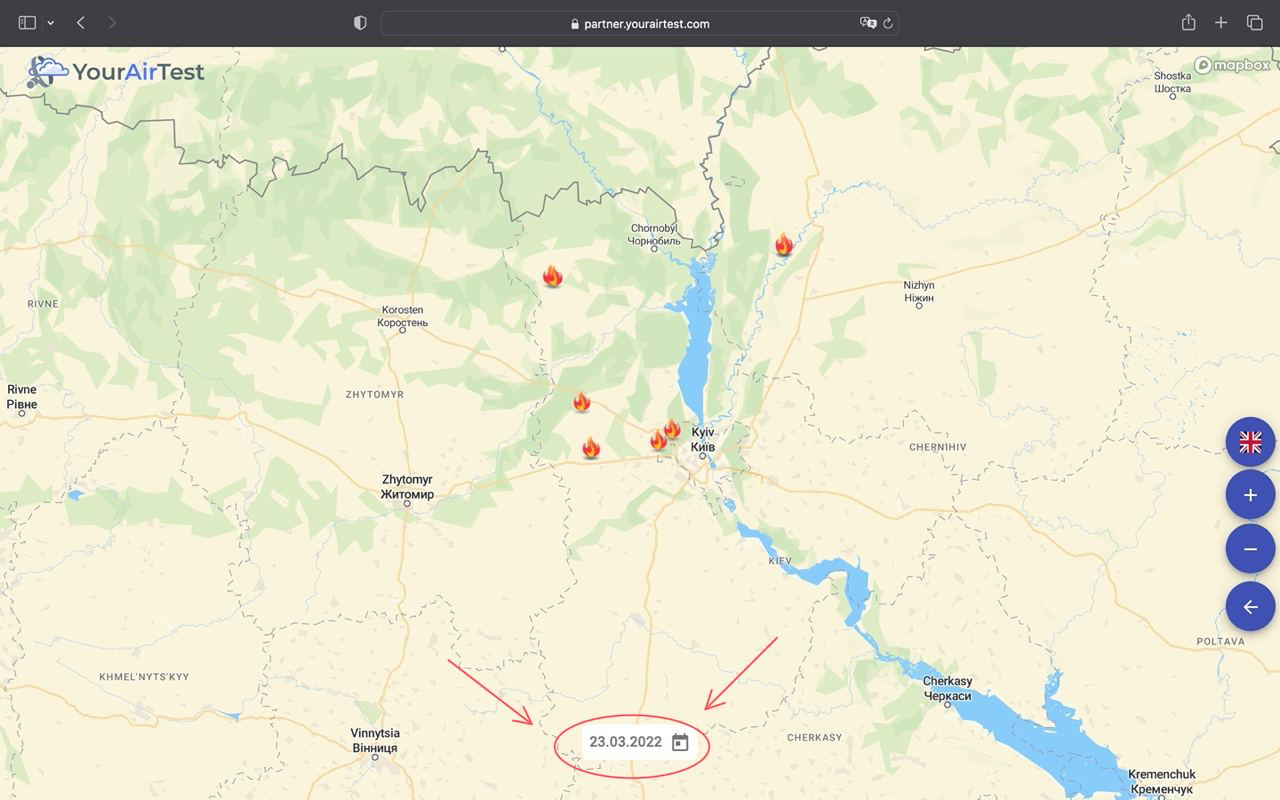 The fire markers indicate where the fire sources were located on that day (they are grouped, so if you zoom in, you will get more information)
Clicking on them opens a menu with details:
- Temperature
- Number of emissions during the observation period
- Coordinates
- Area
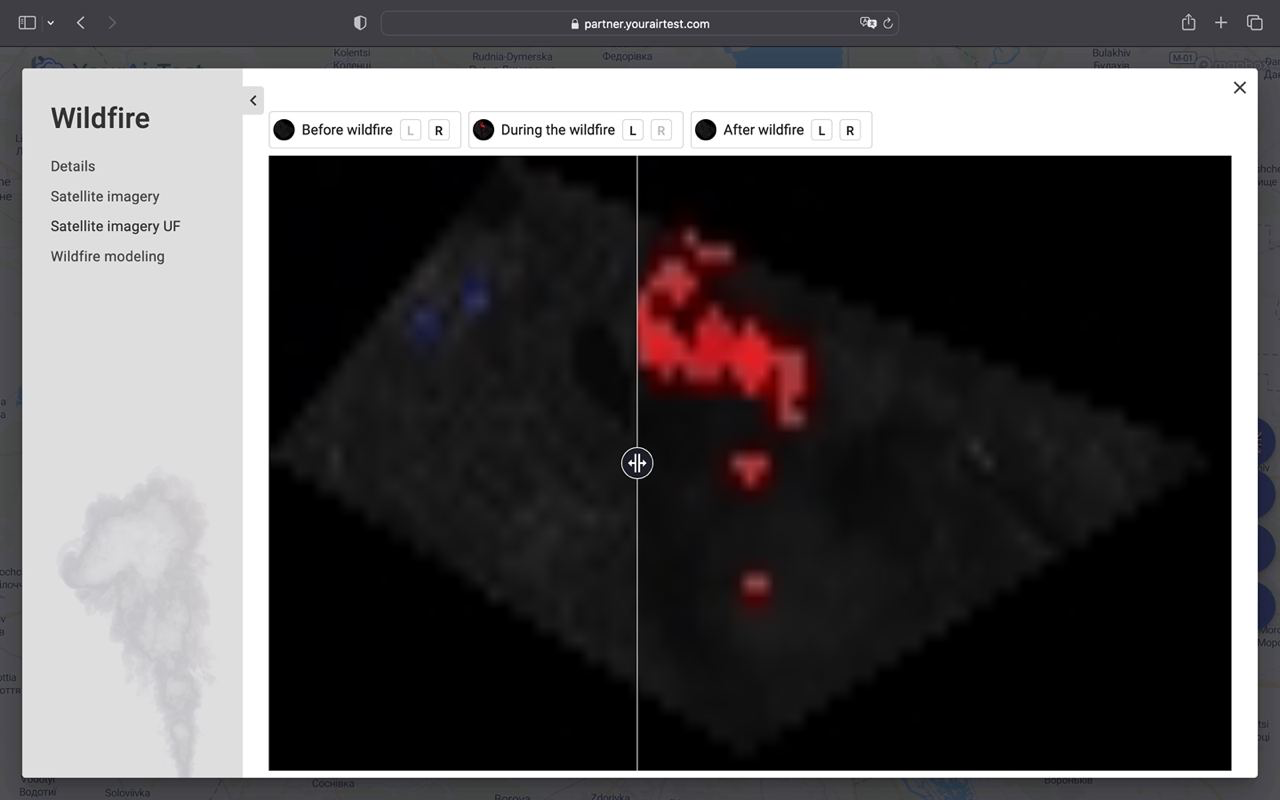
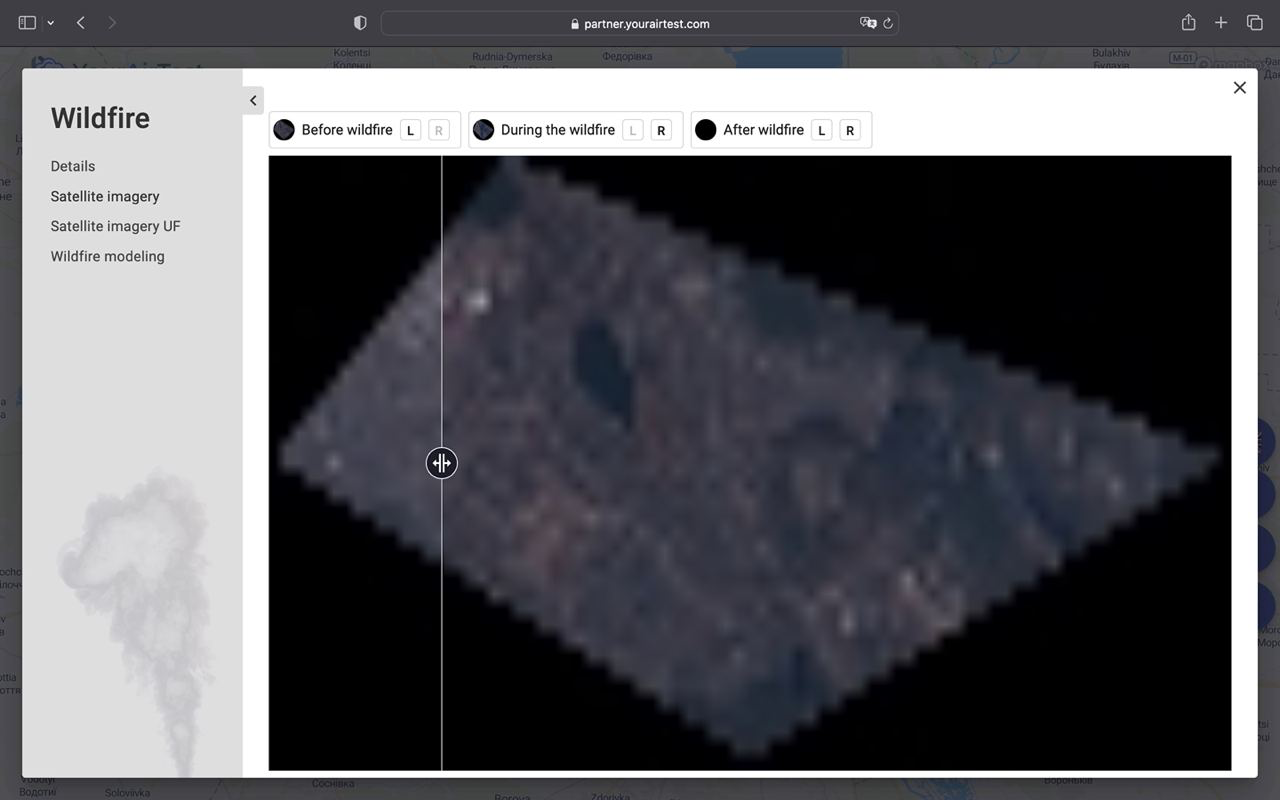
3D visualization
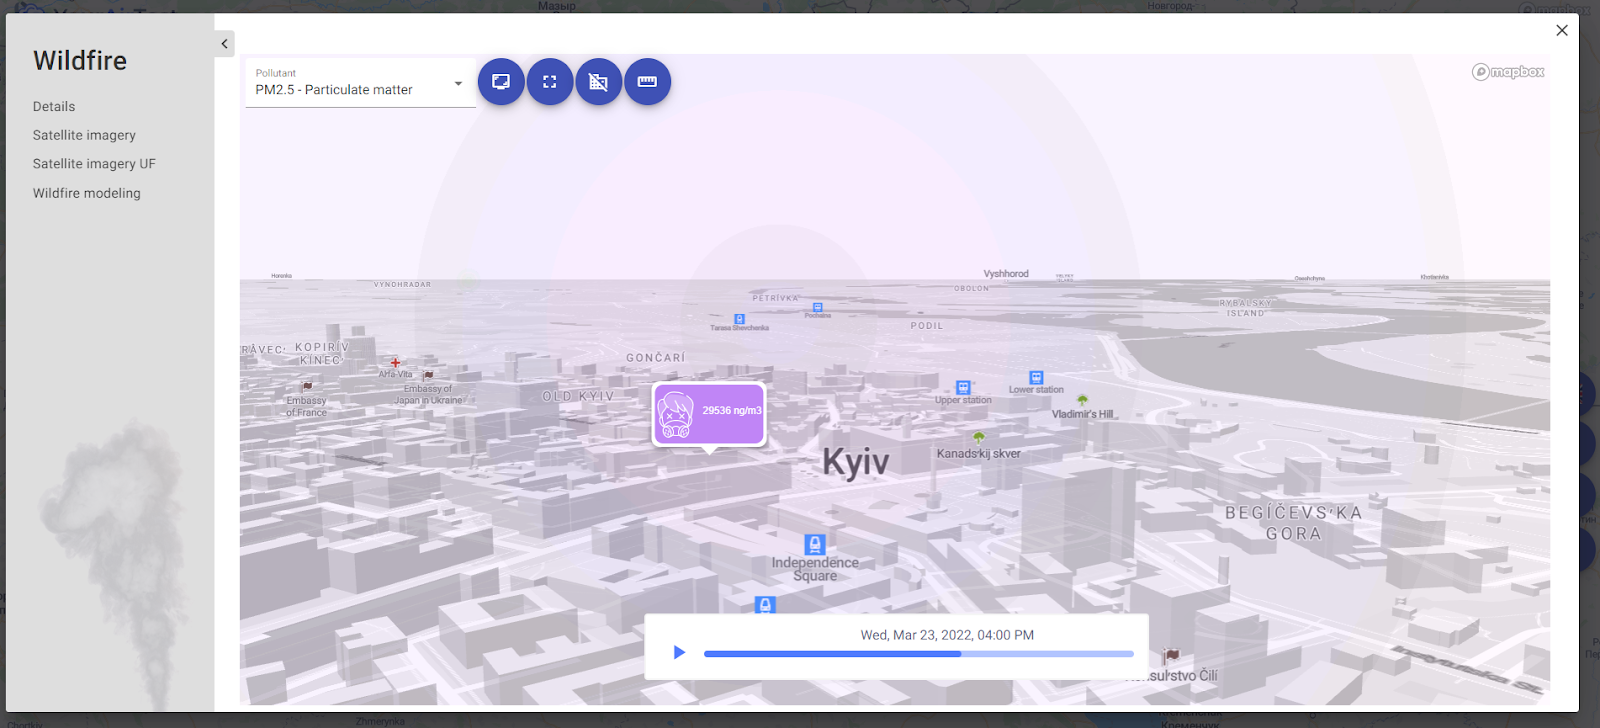
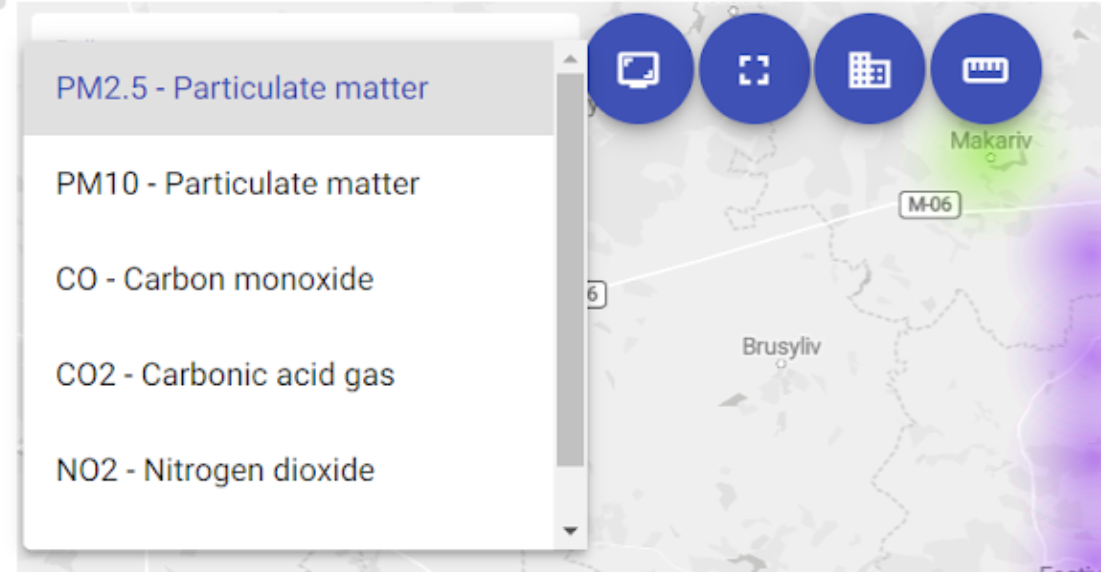
Above is a clickable menu that helps you select the pollutant you need (dust or gas) and displays the concentration of these impurities on the map (colored dots):
- O3 (ozone);
- NO2 (nitrogen dioxide);
- SO₂ (sulfur dioxide);
- CO (carbon monoxide);
- PM2.5 Particulate matter;
- PM10 Particulate matter.
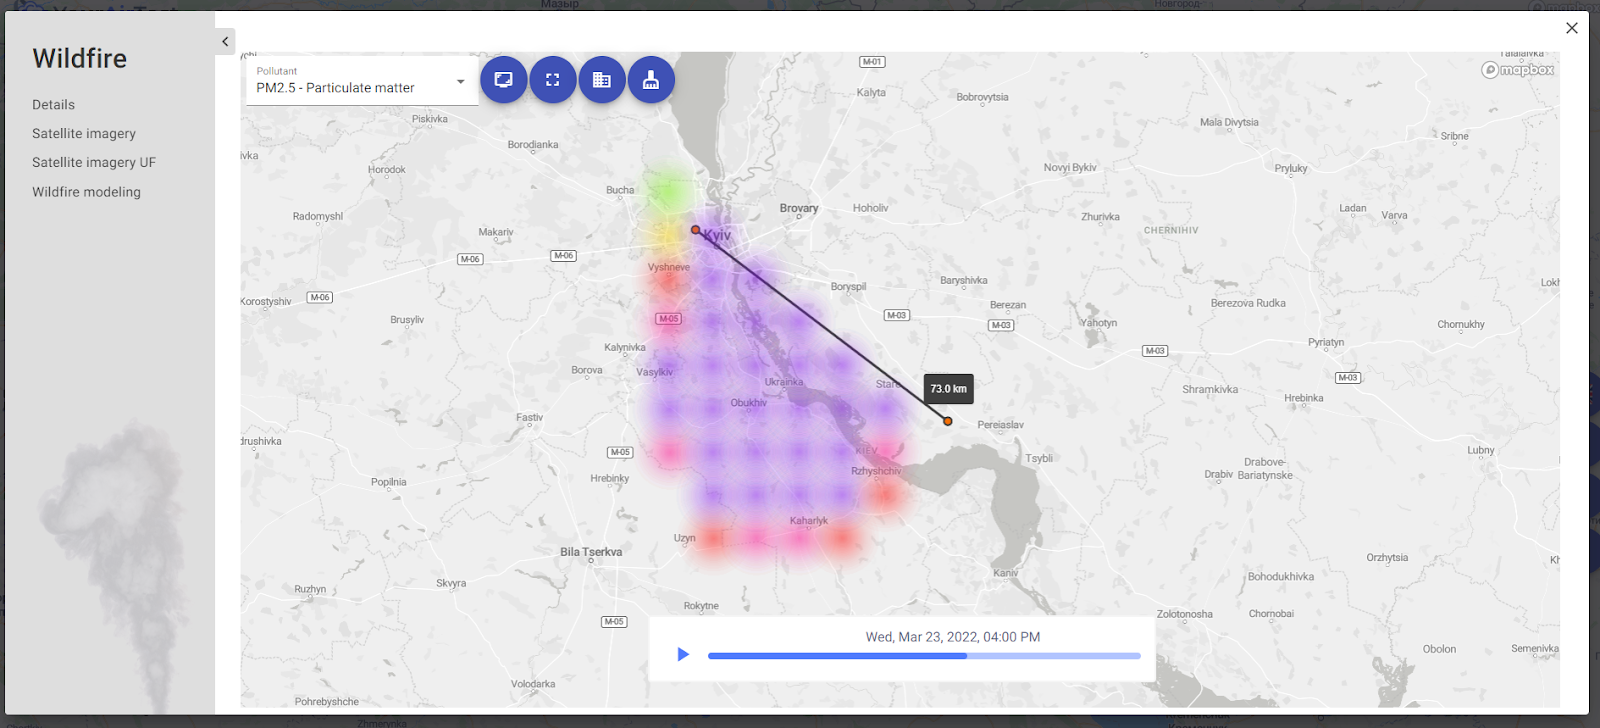
 You can also enable a special ruler in the same menu to help you understand the size of the fire and smoke. This is useful for better calculating the area of air pollution.
 The site is available in two languages (Ukrainian and English) so that our foreign colleagues can contribute to the development and make it easy for everyone to use!
Follow the link and try it!
Ukrainian startup ecosystem: follow TechUkraine and AIN.ua — the two leading outlets covering Ukrainian deep tech, climate tech, and environmental startups.
Follow Ukrainian media: Ekonomichna Pravda, Mind.ua, and Hromadske regularly cover the environmental consequences of war, air pollution, and infrastructure risk in Ukraine.
What to do today
- Check the YourAirTest air map for your city.
- If this resonated — share the article.
- Subscribe to our articles on air quality in Ukraine.