Our algorithms are designed to analyze video streams from surveillance cameras and reports from satellite platforms (NASA FIRMS, Copernicus) 24/7. We automatically filter out false alarms and instantly notify the responsible services and communities of the first signs of a fire.
We use neural networks to recognize smoke in videos and correlate it with satellite data
The result is that we develop automatic alerts for rescuers and communities in the first minutes of a fire.

The lack of accurate and on-time data on fires makes it challenging to address this problem effectively
Prognostic analysis of fires
Air impact assessment

Existing systems show where fire is. WildFiresUA shows where fire will be — and where the smoke will go. Our mission: give Ukraine the wildfire forecasting capability it currently lacks. Three modules, open data, built for local conditions.
This is how the journey to create a forest fire monitoring and analysis system in Ukraine began.
It is important to understand that large-scale fires pose a great threat to human life and health, even in regions far from the fire zone itself, as smoke can sometimes spread for tens of kilometers or more.
WildfiresUA - Identification
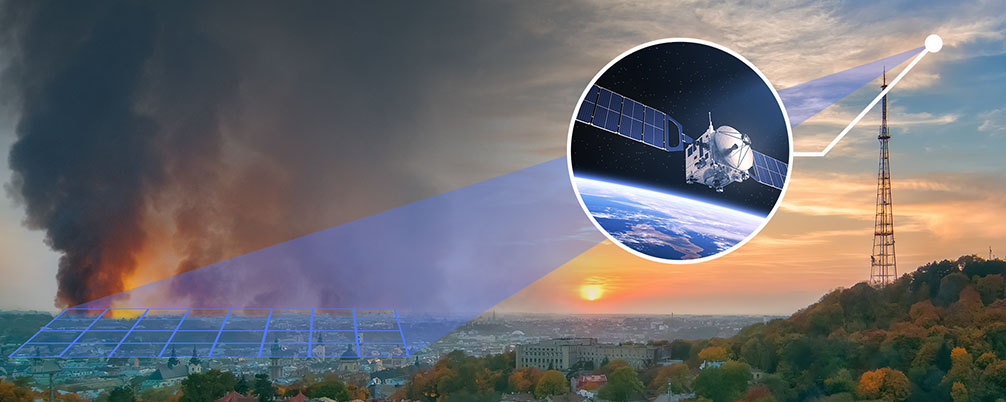
The system uses AI to detect fires with cameras that can be installed on tall telecommunications towers and other structures, and then supplements this with satellite data to more accurately determine the source of the fire.
Wildfires

WildfiresUA Identification

Detection from cameras

Detection from satellites
Meteorological forecasting

WildfiresUA Evolution

Fire evolution modeling
WildfiresUA Pollution

Assessment of emissions and their spread
User alerts


Decision Support System


WildfiresUA Evolution is a modern forecasting system designed to provide critical information during forest fires. Accurate determination of the trajectory and speed of fire is our priority, as it is the key to protecting people, critical infrastructure, and the environment from the devastating effects of natural disasters.
Our system combines proven global modeling standards with our own detailed adaptation for Ukrainian conditions.
Ukraine's AS "Fires" system and DSNS command centers show active hotspots. Copernicus EMS provides post-event mapping. None of them forecast fire spread. Evolution is the missing piece — it answers the question every incident commander needs: where will the fire be in 6-72 hours?

In-house Developments WildfiresUA system
We develop our own algorithms and interfaces to integrate, optimize, and visualize data, providing real-time calculations

WindNinja
A specialized tool for accurate modeling of local wind flows, which are critical for predicting flame spread in mountainous and complex terrain

FlamMap
Used as a free third-party benchmark to verify our system’s fire development simulations and determine the maximum flame intensity and length in a specific area

Propagator
Used as a benchmarking tool to verify our system’s fire development modeling, evaluate fire spread scenarios, and compare predicted fire boundaries.
Finney, M.A., Brittain, S., Seli, R. C., McHugh, C.W., and Gangi, L. 2023. FlamMap: Fire Mapping and Analysis System https://www.firelab.org/project/flammap.
Forthofer, J.M., S.G. Butler, C.P. McHugh. WindNinja. USDA Forest Service, Rocky Mountain Research Station, Fire Sciences Lab. https://ninjastorm.firelab.org/windninja/


How this will help key industries
We are developing an integrated alert system that will help emergency services and local communities receive rapid and informative alerts about threats, prioritize evacuations and resources.

Infrastructure and energy
We are working on features that will allow energy companies and infrastructure operators to receive early warnings about threats to power lines, gas pipelines, and other critical facilities, plan preventive measures, and reduce recovery time.

Forestry
We are developing tools to monitor threats to forests and plantations: risk maps, estimates of potential damage areas, and data for post-fire recovery.

Fuel Maps
The basis for accuracy is the Fuel Map, which determines the type of vegetation and combustible materials

Current status
Anderson's fuel map (13 fuel classes) has already been completed and tested for a number of territories in Ukraine

Our plans
We are actively working on developing highly detailed Scott-Burgen fuel maps (40 classes), which will significantly improve the accuracy of future modeling

Meteorological data
We use up-to-date real-time meteorological data, including wind speed and direction, humidity, and air temperature

Digital terrain models (DTM)
Terrain analysis takes into account slopes and exposure, which directly affect the speed and shape of fire spread
Thanks to powerful calculations, our system allows you to see detailed fire development scenarios for the coming hours and days ahead. This information is vital for making operational decisions about evacuation, resource allocation, and protection of target objects.


WildfiresUA Pollution is an innovative analytical module designed to accurately model and predict pollutant emissions from forest fires. Understanding the trajectory and concentration of pollutants in the air is critical for health protection, operational safety, and environmental monitoring in times of war and natural disasters to protect the health and environmental safety of the population.
The system provides a complete cycle of monitoring, analysis, and forecasting of the consequences of forest fires, integrating satellite data, fire spread modeling, and emissions.
Detailed fire analysis
After selecting a fire, the first details panel opens, containing quantitative data about the fire:
Basic parameters:
Calculation of emission concentrations:
This section shows confirmation of the fire using satellite data:

The most important stage concerning the WildfiresUA Pollution module is forecasting the impact on air quality.
Emission models: The system uses its models to forecast the movement of calculated pollutants.
Plume visualization: The interactive map displays the predicted plume of pollutant dispersion (marked with a purple cloud).
Predicted concentration: The user can select individual pollutants PM2.5, PM10, NO2, SO2, O3 to see how their concentration spreads in the city and surrounding areas over a certain period of time. You can enable 3D mode and see what the concentration of emissions was near a house that you can select on the map.

The system displays fires detected using satellites with varying levels of detail. On the interactive map, we provide information about specific fires, including temperature, emissions quantities (PM2.5, PM10, CO, CO2, NO2, SO2), coordinates, and area in square kilometers. We also classify emissions by types and show their concentration over specific time periods.
To achieve this goal, we have developed seven core directions for our development
WildFiresUA offers a user-friendly interface for our users and provides accurate and timely information that helps in effective response to fires and their consequences. We are proud to support you in ensuring clean air and protecting the environment. YourAirTest · WildFiresUA · Wildfire forecasting for Ukraine